Britain now has over 660,000 property millionaires after years of soaring house prices
Data from Zoopla reveals the most expensive streets in Britain to buy a home.

Britain now has 660,924 property millionaires, according to research by the listings website Zoopla, a rise of 6.6% since January alone as house prices rise rapidly across the country.
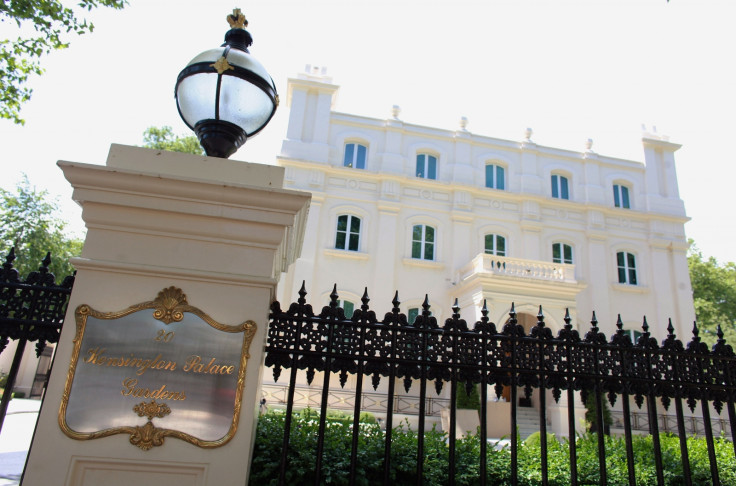
Zoopla said in its "Rich List 2016" that 12,418 streets in Britain had an average property price of over £1m (€1.2m, $1.3m). The most expensive is Kensington Palace Gardens in London's W8 postcode, which has an average price of £38,266,143 and is home to Saudi royalty and the steel magnate Lakshmi Mittal.
All of the top 10 streets are in London. Over 60% of the country's property millionaires are based in the city, where prices have rocketed in recent years off the back of a serious supply shortage and intense demand from investors and homebuyers.
"While Kensington Palace Gardens continues to hold the top spot in the Rich List, it's interesting to see some property values in the most expensive neighbourhoods decreasing over the past 12 months," said Zoopla's Lawrence Hall.
Outside of London, the most expensive area was Virginia Water, Surrey, with an average house price of £1.3m. "Whilst London will always attract buyers for trophy homes from across the globe, those looking for million pound plus homes should also consider areas outside the capital that make the list such as Guildford, Sevenoaks or Esher, where they will get more bang for their buck," Hall said.
Top 10 most expensive streets
| Rank | Street name | Average property value |
| 1 | Kensington Palace Gardens, W8 | £38,266,143 |
| 2 | The Boltons, SW10 | £33,314,108 |
| 3 | Grosvenor Crescent, SW1X | £21,635,151 |
| 4 | Courtenay Avenue, N6 | £19,000,018 |
| 5 | Manresa Road, SW3 | £13,281,914 |
| 6 | Compton Avenue, N6 | £13,212,238 |
| 7 | Frognal Way, NW3 | £12,797,040 |
| 8 | Ilchester Place, W14 | £12,774,204 |
| 9 | Cottesmore Gardens, W8 | £10,816,448 |
| 10 | Chester Square, SW1W | £10,635,410 |
Top 10 most expensive neighbourhoods
| Rank | Outcode | Average property value |
| 1 | SW7 (Knightsbridge) | £2,715,273 |
| 2 | W8 (Kensington) | £2,706,626 |
| 3 | SW3 (Chelsea) | £2,530,643 |
| 4 | W11 (Notting Hill) | £1,858,258 |
| 5 | SW1 (Westminster) | £1,759,788 |
| 6 | W1 (West End) | £1,719,589 |
| 7 | SW10 (West Brompton) | £1,619,148 |
| 8 | NW3 (Hampstead) | £1,543,919 |
| 9 | SW13 (Barnes) | £1,537,919 |
| 10 | NW8 (St John's Wood) | £1,478,024 |
Neighbourhoods with the most streets worth £1m or more (excluding London)
| Rank | Post town | Number of £1m+ streets |
| 1 | Guildford | 184 |
| 2 | Reading | 162 |
| 3 | Leatherhead | 152 |
| 4 | Sevenoaks | 150 |
| 5 | Maidenhead | 145 |
| 6 | Esher | 127 |
| 7 | Woking | 120 |
| 8 | Beaconsfield | 113 |
| 9 | Farnham | 111 |
| 10 | Harpenden | 110 |
Britain's property millionaires
| Rank | Region | Number of Property Millionaires | % of Britain's total Property Millionaires |
| 1 | London | 398,312 | 60.27% |
| 2 | South East England | 145,886 | 22.07% |
| 3 | East of England | 54,031 | 8.18% |
| 4 | South West England | 23,855 | 3.61% |
| 5 | North West England | 9,680 | 1.46% |
| 6 | Scotland | 8,486 | 1.28% |
| 7 | West Midlands | 7,778 | 1.18% |
| 8 | East Midlands | 4,354 | 0.66% |
| 9 | North East England | 3,724 | 0.56% |
| 10 | Yorkshire and The Humber | 3,164 | 0.48% |
| 11 | Wales | 1,654 | 0.25% |
Source: Zoopla


© Copyright IBTimes 2025. All rights reserved.


