London: The Information Capital – From Generation Rent to Miserable Islington [IMAGES]

Data is the order of the day. Big data, small data, infographics, interactive data visualisations. You cannot move these days for the digestion and presentation of numbers.
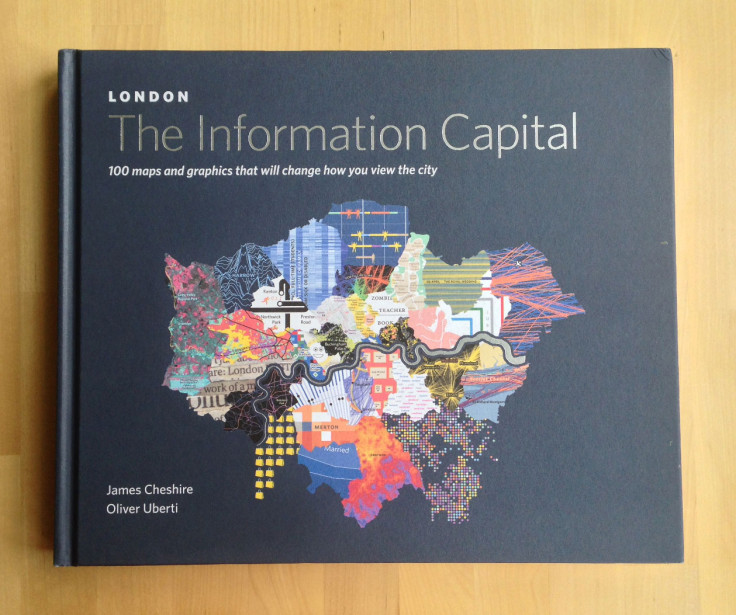
London: The Information Capital is a fascinating and smartly designed manifestation of this trend. It contains 100 visualisations of data from the English capital, each telling its own interesting, profound or amusing story.
The book's two award-winning authors, UCL geographer Dr James Cheshire and data journalist Oliver Uberti, have trawled various organisations and institutions for data on London.
For months they slavishly prepared the raw data before transforming it from the coded gobbledygook of numbers-smattered spreadsheets into comprehensible elegance.
From the most disrupted Tube lines, to the ethnic make-up of the different areas, to life expectancy, to crimes committed, to flight routes over the city and more, the book is packed with insights about London.
And it contains loads of facts to quote at colleagues or down the pub. Did you know London Underground trains travel over 75 million km every year, equivalent to circling the earth 1,900 times? Or that in one area of the City of London the night time population is 222, but by day commuters have swelled this to 127,000?
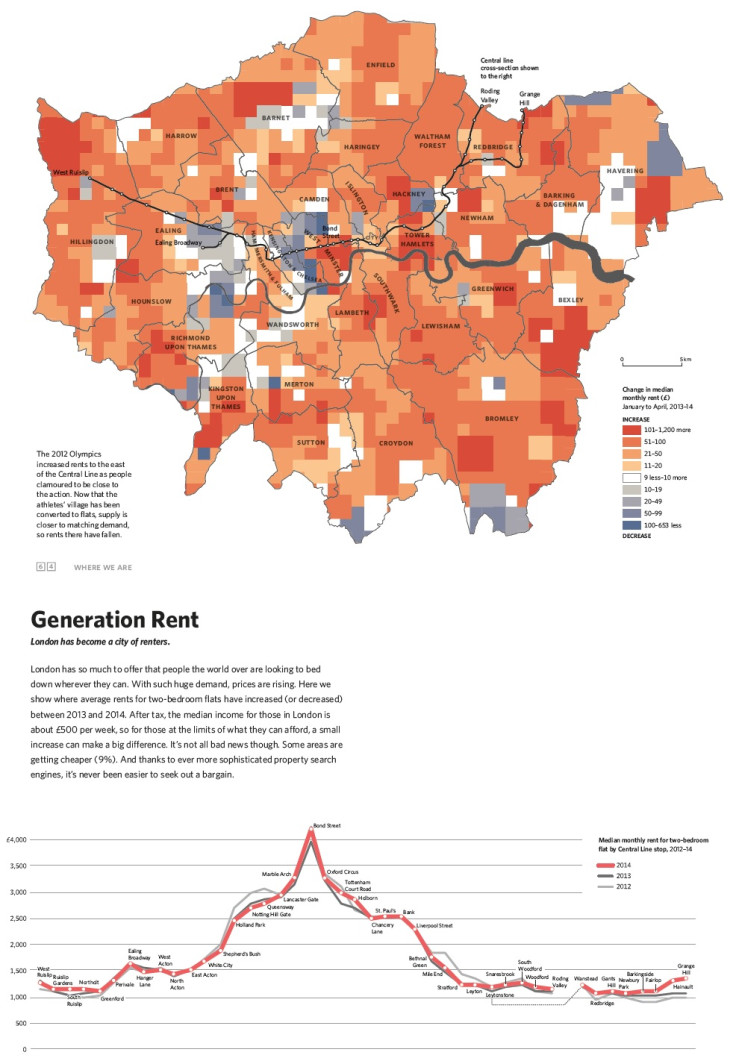
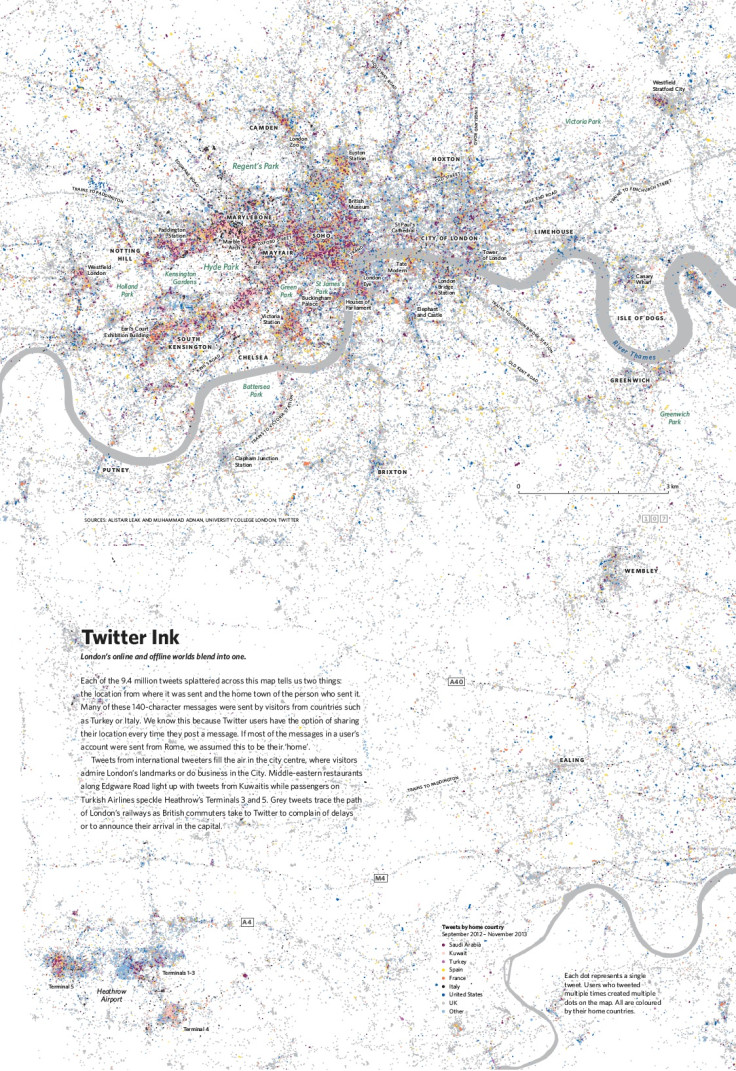
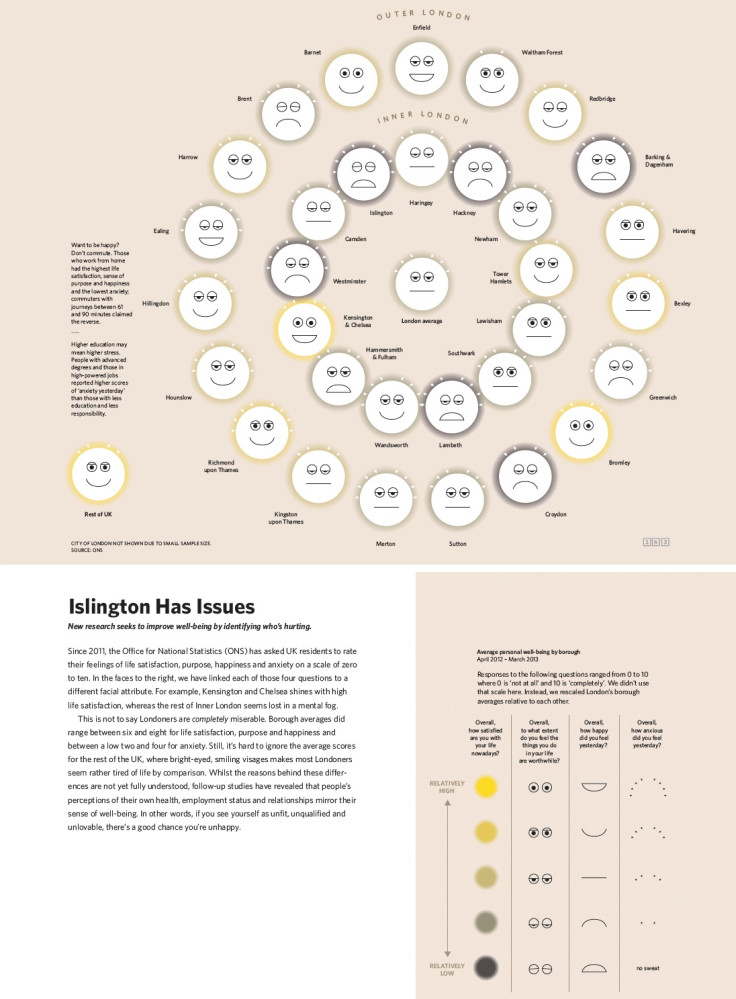
It will be published on 30 October by Particular Books, a branch of Penguin, and goes on sale in hardback for £25. Here are just three of the designs within it.


© Copyright IBTimes 2024. All rights reserved.


