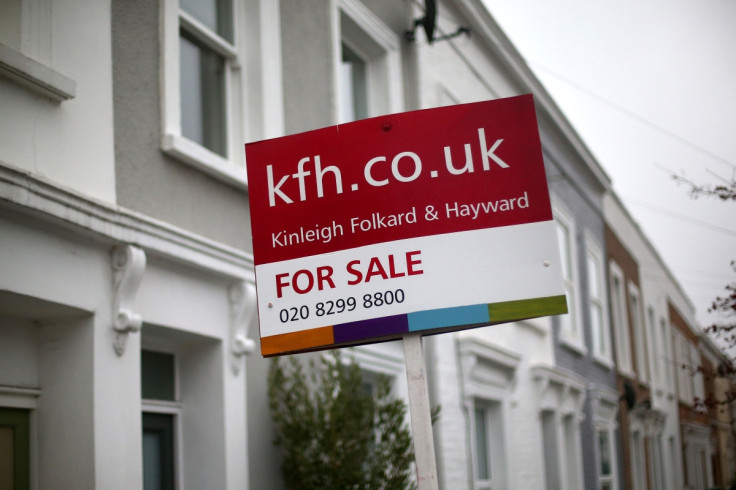
London property prices show 'remarkable fortitude' in face of Brexit
Land Registry and ONS data shows London property outperformed all other regions of the UK in September.

House prices in London rose faster than anywhere else in the UK during September when compared with the previous month, according to an official index, despite a slowdown at the top-end of the city's housing market and affordability issues for first-time buyers.
Tax hikes on property investors and purchases of expensive homes have weakened the prime London market, while Brexit has sparked economic uncertainty, with London's status as the world's leading financial centre brought into question.
Moreover, rapid price rises in London well ahead of earnings, fuelled by intense domestic and foreign demand against an acute shortage of housing, have pushed buying a home out of reach for many people without the help of schemes such as shared ownership.
But the average London price rose 1.4% month-on-month to £487,649. Next highest regions, the East Midlands and East of England, saw 0.7% monthly growth to averages of £175,441 and £277,248, respectively. Bottom was the North East, where the average fell 1.9% to £125,213.
Annually, London prices grew by 10.9%, the slowest pace for nine months but still the second fastest growth of all regions. The average UK house price was £217,888, up 0.2% on the month and 7.7% over the year. For England, the average price grew 0.2% over the month and 8.3% over the year to £234,250.
That is according to the official UK house price index, compiled by Land Registry and the Office for National Statistics (ONS), for September 2016. "Housing market indicators for September suggested a period of relative stability during the month," according to the index.
| Region | Monthly change since August 2016 (%) | Annual change since September 2015 (%) | Average price September 2016 |
| East Midlands | 0.7 | 8.2 | £175,000 |
| East of England | 0.7 | 12.1 | £277,000 |
| London | 1.4 | 10.9 | £488,000 |
| North East | -1.9 | 1.5 | £125,000 |
| North West | 0.2 | 5.7 | £151,000 |
| South East | -0.9 | 9.9 | £313,000 |
| South West | 0.6 | 7.5 | £241,000 |
| West Midlands | 0.3 | 7.7 | £181,000 |
| Yorkshire and The Humber | -0.4 | 4.7 | £151,000 |
| Wales | 0.2 | 4.4 | £146,000 |
| Scotland | 0.2 | 3.4 | £143,000 |
| Northern Ireland | 0.8 | 5.4 | £124,000 |
| England | 0.2 | 8.3 | £234,000 |
| UK | 0.2 | 7.7 | £218,000 |
Source: ONS/Land Registry
"Despite dire predictions in the aftermath of Brexit, UK property prices continue their ponderous march upwards," said Ben Madden, managing director of London estate agents Thorgills. "Against a mostly unremarkable showing from property price growth nationwide, London has shown remarkable fortitude in outperforming all other regions of the UK.
"Clearly a lack of supply in the capital is helping to prop up prices, but perhaps there's an element of seller resilience as we head into the usually slower winter months."
Beneath the headline London figure are sharp differences between the boroughs. The more expensive boroughs in central areas, such as Hammersmith and Fulham, are seeing property prices drop after stamp duty increases. But cheaper fringe boroughs, such as Newham, are experiencing rapid price increases as buyers seek out value in the city, creating a ripple effect.
| London borough | September 2016 | September 2015 | Difference (%) |
| Newham | £371,139 | £308,543 | 20.3 |
| Barking and Dagenham | £290,583 | £243,479 | 19.3 |
| Havering | £355,702 | £299,875 | 18.6 |
| Croydon | £373,339 | £320,175 | 16.6 |
| Redbridge | £413,979 | £355,375 | 16.5 |
| Bexley | £332,507 | £286,281 | 16.1 |
| Waltham Forest | £430,057 | £371,423 | 15.8 |
| Enfield | £404,397 | £350,230 | 15.5 |
| Sutton | £379,977 | £334,099 | 13.7 |
| Bromley | £447,488 | £393,831 | 13.6 |
| Tower Hamlets | £478,977 | £421,779 | 13.6 |
| Lewisham | £417,249 | £368,741 | 13.2 |
| Hillingdon | £409,481 | £364,789 | 12.3 |
| Greenwich | £383,524 | £341,716 | 12.2 |
| Harrow | £475,384 | £424,056 | 12.1 |
| Hounslow | £406,002 | £365,749 | 11 |
| Brent | £498,676 | £449,823 | 10.9 |
| Haringey | £563,248 | £508,006 | 10.9 |
| Barnet | £535,903 | £484,487 | 10.6 |
| Hackney | £574,800 | £523,696 | 9.8 |
| Southwark | £531,638 | £485,699 | 9.5 |
| Kingston upon Thames | £488,520 | £450,685 | 8.4 |
| Merton | £518,930 | £480,330 | 8 |
| Ealing | £486,914 | £453,923 | 7.3 |
| Lambeth | £542,485 | £508,248 | 6.7 |
| Richmond upon Thames | £681,964 | £643,019 | 6.1 |
| Wandsworth | £620,127 | £589,802 | 5.1 |
| Islington | £679,767 | £657,610 | 3.4 |
| Kensington And Chelsea | £1,379,488 | £1,353,679 | 1.9 |
| City of London | £774,937 | £767,464 | 1 |
| City of Westminster | £961,686 | £971,985 | -1.1 |
| Camden | £813,057 | £833,334 | -2.4 |
| Hammersmith and Fulham | £757,131 | £779,596 | -2.9 |
Source: ONS/Land Registry
© Copyright IBTimes 2025. All rights reserved.


