Technical analysis: Will USD index hit 100 in 2015?

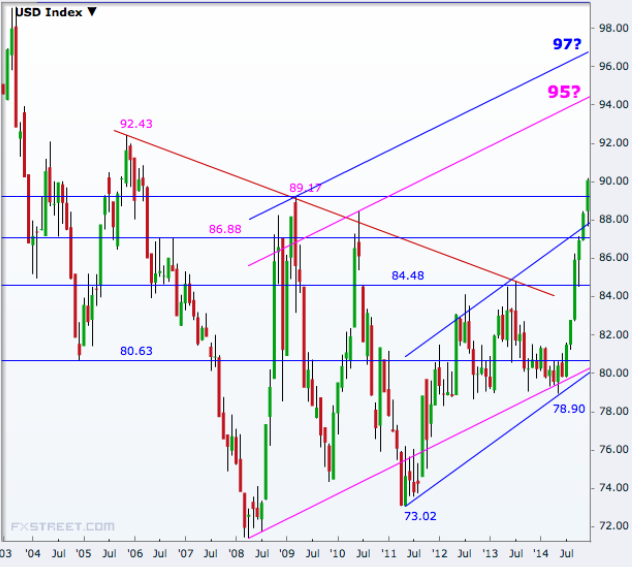
After hovering around 80 in the first half of 2014, the USD index made a spectacular 12.8% rally in the second half, translating to a 12.5% rally for the year and charts show potential for further upside towards an 11-year high.
The dollar index, the gauge that measures the US currency's trade-weighted strength versus a basket of six major currencies, ended all the six months starting July higher, matching the six months through May 2010 during which it rallied more than 15%.
At this month's peak of 90.16, the index hit its March 2006 levels and the next resistance charts show is 92.43. A break of that will take the dollar gauge to its highest since late 2003.
The break of the lower highs-higher lows pattern since 2005 executed by the September jump in the index grew to a decisive pattern break in the following months, breaking new resistance levels month after month.
The question now is which upside channel the index is in. If the narrow one which can be traced back to 2011 lows is considered, then the upside barrier has been decisively broken, placing the index in a channel with a higher upside barrier.
If the 2010 high is taken for drawing the upside barrier, it points to levels above 94 and if the 2009 highs are taken, then levels above 97 will loom large.
That essentially means the dollar index is technically headed for 100 in the coming months, breaking the 2003 peak of 99.12.
© Copyright IBTimes 2025. All rights reserved.


