6 charts that explain the UK general election results
Theresa May's Conservatives failed to win a majority after the 2017 general election produced a hung parliament.
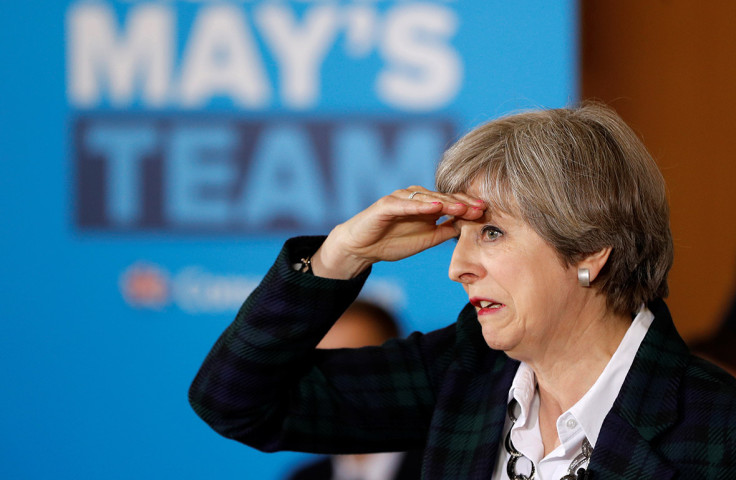
In a general election that surprised many people, the UK faces the political turmoil of a hung parliament. Theresa May's Conservatives failed to live up to their polling expectations after her disastrous election campaign, which squandered a big lead among voters.
Labour under Jeremy Corbyn, who had been largely written off, ran a solid campaign and launched a well-received manifesto, leading the party to significantly outperform many forecasts and predictions.
With just one seat left to be called - the knife-edge vote in Kensington, which could go blue or red - the Conservatives have 318 seats, Labour 261, the SNP 35, the Lib Dems 12, the DUP 10, and other parties have 13, including one for the Greens.
In 2015, the Conservatives won a surprise 12-seat majority on 36.9% of the vote as Labour were all but wiped out in Scotland by the SNP. And the SNP became the third largest party in parliament when the Liberal Democrats collapsed after a bruising few years as coalition partner to the Tories.
While the Conservatives have in 2017 won a larger share of the vote at 42.4%, benefitting from the decline of Ukip in particular, there were not enough votes in the key marginals to offset a surge in support for Labour, which secured 40%, up from 30.4% in 2015.
For a majority in the House of Commons, 326 seats are needed. The Conservatives are hoping to partner in some sort of coalition with Northern Ireland's DUP, taking them to 328 seats, a reduced majority from before the election but one which would allow May to form a government. Corbyn said he and Labour are ready if May should fail.
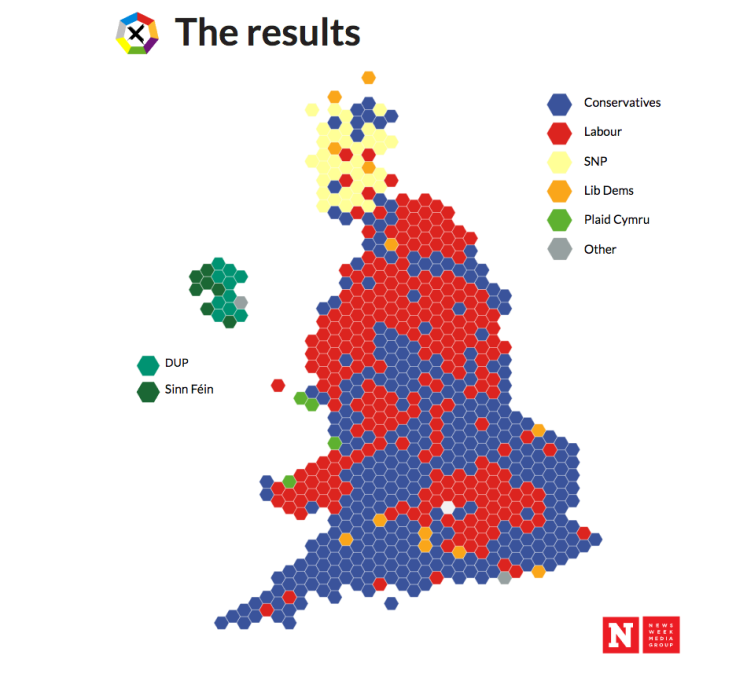
As the results map below shows, Labour performed very strongly across the north of England and in London, and also picked up seats in Wales and Scotland. Meanwhile, the Conservatives won plenty of seats in the Home Counties, South East, and South West of England, picking up a decent chunk in Scotland from the SNP and a few in the north too.
Just how many seats the four biggest parties won can be seen in the next chart: their 2017 election performance is compared to that of 2015, and the 2015 result is compared to 2010.
A big portion of the SNP's gain in 2015 was taken away in 2017. Conservatives halved their 2015 gain, while Labour more than compensated for its losses in the same year. The Lib Dems made a minor improvement.

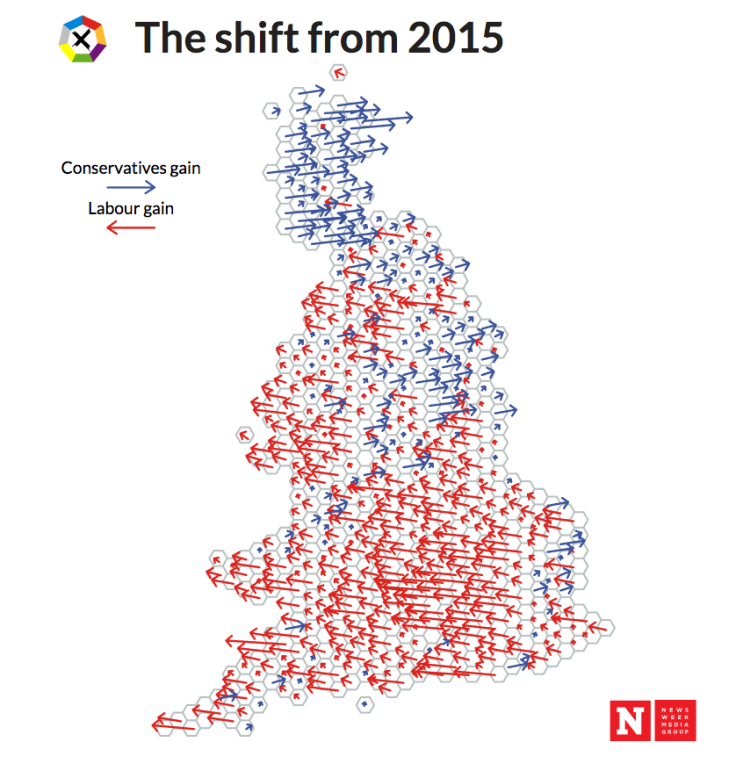
The biggest improvement for either Labour or the Conservatives in each constituency across the country when compared to the 2015 general election shows a mixed picture. The arrows are to scale - the bigger they are, the larger the increase in the vote share of that party in that seat.
Labour made strong gains in their vote share across much of England: in the Midlands, London and the South East, and South West, as well as areas of the north, reflecting Corbyn's cross-country rallying during the campaign.
Meanwhile, very strong Conservative gains can be seen in Scotland where the Scottish Tory leader Ruth Davidson campaigned hard to capitalise on frustrations about the prospect of a second independence referendum, which the SNP is pushing for.
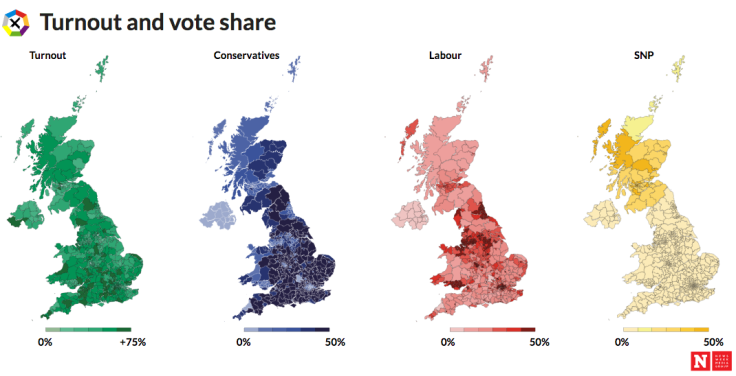
Turnout across the country was varied. The first map shows the general voter turnout across all parties, with the highest turnouts tending to be in urban areas in and around large cities.
The next three maps show the turnouts for the Conservatives, Labour, and the SNP. The Conservatives have very strong turnouts across rural England, which is the historic core of the Tory vote. Similarly, Labour performed well in the urban hubs such as London and Manchester, for example, which are areas of core support for the party.
The SNP's turnouts are strong in the west of Scotland and the central areas, but look weaker in the surrounding parts.
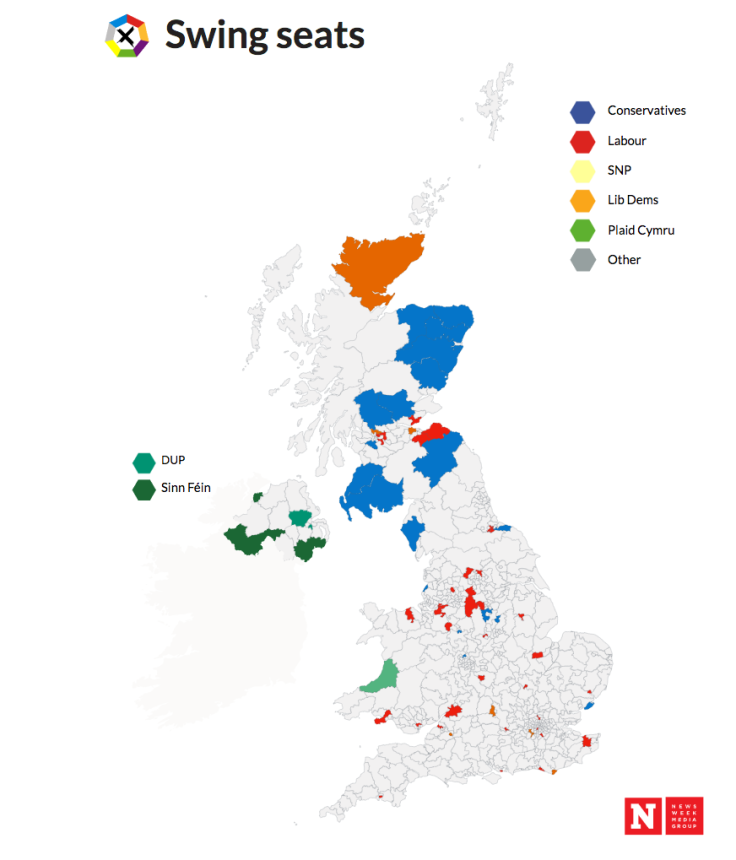
This map shows where all of the swing seats are, meaning those which have been gained by one party from another. The gaining party is shown on the map. We can see, for example, that Canterbury right down in Kent in the South East of England is conspicuously red - a Labour gain from an old Tory safe seat.
Perhaps most glaring is the blue in Scotland, where the Tories gained 17 seats, among them Angus, Aberdeenshire West and Kincardine, and Stirling, all three of which were taken from the SNP.
There is also a few Liberal Democrat gains as the party made a small advance on its 2015 catastrophe, picking up Caithness, Sutherland & Easter Ross from the SNP, Oxford West & Abingdon from the Conservatives, and Twickenham, again from the Tories.
Some of the seats won and lost tell a story about the wider election.
Labour overturned a wafer-thin Conservative majority in Derby North to win by almost 2,000 votes in what was tipped before the election as a key test seat for Corbyn because it was the most marginal constituency in England.
If he couldn't reclaim the seat lost by Labour to the Conservatives at the 2015 general election, in one of the party's old heartlands, then what hope for the rest of the country? It was also being contested by Chris Williamson, dubbed Labour's most pro-Corbyn candidate. And Corbyn passed the test.
Another seat symbolising Labour's surprising surge was Canterbury, a student-dominated city seat that has been Conservative in almost every general election since the late 19th century. Labour's Rosie Duffield narrowly took it from the Conservative Sir Julian Brazier after what looks like a big rise in the youth turnout.
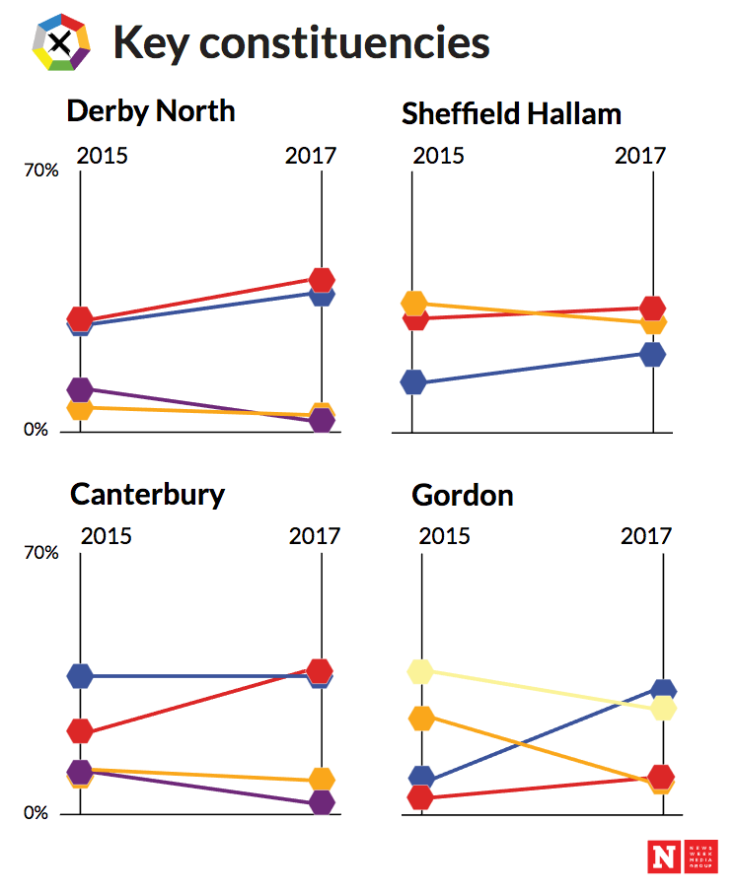
A few of British politics' big beasts lost their seats in the election. Among the most notable was the former Lib Dem leader and deputy prime minister in the 2010-2015 coalition government, Nick Clegg, who lost his Sheffield Hallam seat - which also has lots of students - to Labour's Jared O'Mara.
And there was a big shift north of the border as the SNP's dominance came under attack primarily from the Conservatives over fears of another independence referendum. The Tories snatched 17 seats, among them Gordon, depriving the former SNP leader Alex Salmond of his old place in the Commons. Colin Clark took Gordon for the Tories.
© Copyright IBTimes 2025. All rights reserved.


