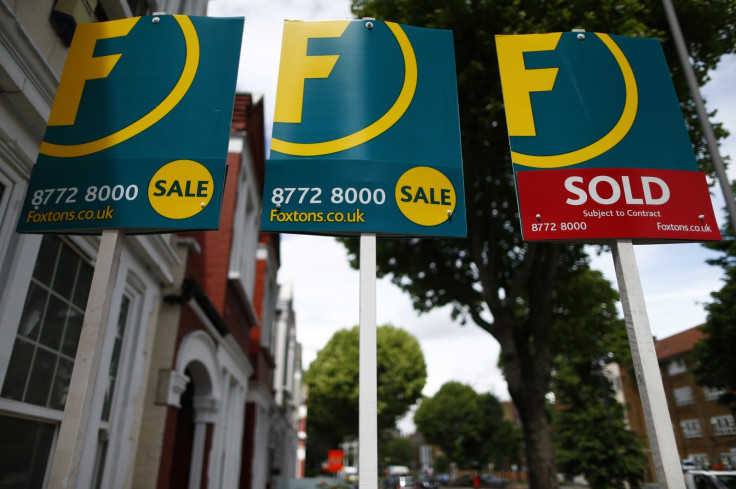
House prices: London property sees double-digit growth in 21 of city's 33 boroughs

Headline house price growth in England and Wales was strong in February 2016 fuelled by an ongoing housing shortage in some areas, particularly London and the South East. Data from Land Registry shows the average price rising 6.1% over the year to £190,275. But the regional picture is much more varied, with London recording the highest rises.
The average price is falling in the North East. It dropped 3.2% in the year to February to £97,582. This is the only region to see prices fall. In Wales, the average price rose 1.2% to £122,573. In Yorkshire and The Humber, the average lifted 4.1% to £125,532.
In London, the average price jumped 13.5% to £530,368, the highest of all regions. London's supply shortage is acute because demand is so high from both domestic and foreign buyers. The city's population, currently around 8 million, is expected to hit 10 million in a few years' time but house building in London is running at half the level needed to meet demand.
High house prices and weak incomes are shutting some aspiring first-time buyers out of the market. Saving for a deposit is difficult and, despite low interest rates, it can be difficult for buyers to secure mortgages large enough for the property they want. The government has a number of schemes in place to help first-time buyers mitigate high prices, including Help to Buy and shared ownership.
| Region | Annual change (%) | Monthly change (%) | Average price |
| London | 13.5 | 0.6 | £530,368 |
| South East | 10.9 | 0.7 | £267,235 |
| East | 9.8 | 0.7 | £220,188 |
| South West | 6.7 | 0.7 | £199,214 |
| East Midlands | 6.2 | 1.5 | £140,977 |
| North West | 4.9 | 1.8 | £117,081 |
| West Midlands | 4.5 | -0.3 | £142,734 |
| Yorkshire & The Humber | 4.1 | 0.9 | £125,532 |
| Wales | 1.2 | -0.1 | £122,573 |
| North East | -3.2 | -1.2 | £97,582 |
"To the millions of ordinary families who are priced out, these sky-high house prices mean the dream of a place to call home is fast becoming nothing more than a fantasy," said Campbell Robb, chief executive of the housing charity Shelter. "Too many people are left stuck in expensive and unstable rentals, or living with their parents well into their thirties."
To dampen the risk of a credit bubble forming while interest rates are abnormally low, the Bank of England tightened mortgage lending rules. Now 85% of a lender's new mortgage lending must comprise loans worth 4.5 times or lower the borrower's income, limiting how much credit people can access.
This is particularly a problem in London, where the average property price is 179% higher than that for England and Wales as a whole. There is double-digit house price growth in 21 of the 33 London boroughs. Prices are higher in the centre of the city, meaning people are looking to buy further out where property is more affordable.
As a result of the higher demand, outer boroughs are seeing sharp increases in house prices. They are growing fastest in Hillingdon in the west, home to Heathrow Airport. The average house price in the borough rose 17.1% in the year to February 2016 to £391,728.
| London borough | Annual change (%) | Monthly change (%) | Average price |
| Hillingdon | 17.1 | 1.4 | 391,728 |
| Havering | 16.9 | 1.5 | 361,331 |
| Lewisham | 16.3 | 2.1 | 456,937 |
| Barking and Dagenham | 16 | 2.1 | 326,461 |
| Waltham Forest | 15.7 | 1.1 | 425,358 |
| Enfield | 15.3 | 1.7 | 379,269 |
| Newham | 14.9 | 1.5 | 345,767 |
| Croydon | 14.7 | 1.1 | 370,766 |
| Hounslow | 13.6 | -0.5 | 409,062 |
| Bexley | 13.3 | 1.2 | 323,746 |
| Greenwich | 13.1 | 0.3 | 399,466 |
| Tower Hamlets | 12.6 | 0.7 | 547,075 |
| Haringey | 12 | 0.2 | 577,018 |
| Sutton | 11.9 | 1.3 | 357,016 |
| Harrow | 11.7 | 1 | 425,111 |
| Redbridge | 11.5 | 2 | 409,629 |
| Brent | 11.2 | 0.4 | 478,285 |
| Merton | 11.2 | -0.8 | 510,395 |
| Hackney | 10.8 | 0.6 | 682,853 |
| Barnet | 10.6 | 2 | 507,738 |
| Bromley | 10 | 0.3 | 425,325 |
| Lambeth | 9.3 | 0.5 | 598,591 |
| Southwark | 8.9 | 0.7 | 610,352 |
| Kingston upon Thames | 8.8 | 1.2 | 454,952 |
| Richmond upon Thames | 8.2 | 0.2 | 672,183 |
| Hammersmith and Fulham | 7.3 | 2.2 | 846,355 |
| Wandsworth | 7.3 | 0.8 | 622,857 |
| Islington | 7 | 0.8 | 711,077 |
| City of Westminster | 6.7 | 0.3 | 1,057,034 |
| Ealing | 6.7 | 0.2 | 494,437 |
| Kensington and Chelsea | 5.6 | -0.1 | 1,396,753 |
| Camden | 3.6 | 0.2 | 858,067 |
| City of London | n/a | n/a | n/a |
© Copyright IBTimes 2025. All rights reserved.


