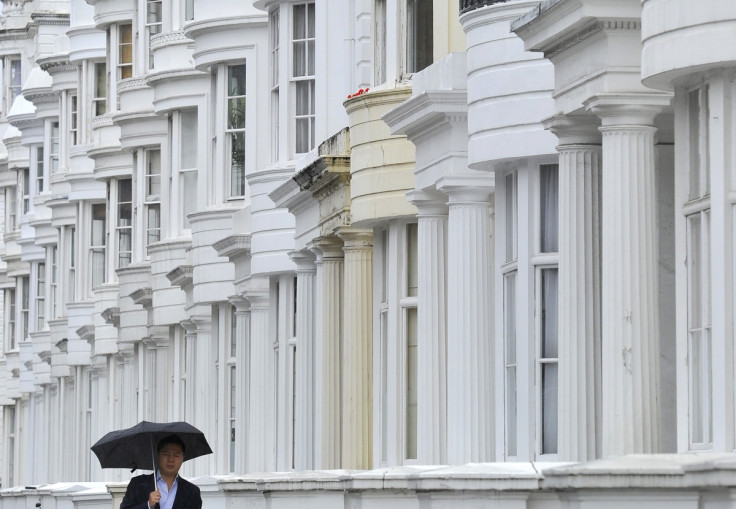
Number of homes sold in London plunges by almost 40%
Land Registry data shows house prices in London holding up as housing supply shortage continues.

The number of completed home sales in London fell sharply over the 12 months to September 2016, according to the latest Land Registry data. The annual drop was 39.5% to 6,698 sales during the month.
This drop reflects a number of affordability issues for first-time buyers, tax hikes on investors and expensive homes, and uncertainty surrounding Brexit. There has been a significant slowdown in the prime central London market, in particular.
Yet the city's house prices continue to grow sharply in many areas, supported by a severe housing shortage. Around half of the 50,000 new homes needed every year in London are currently being built.
Land Registry's house-price index for November 2016 stated that London's average price rose by 8.1% over the year to £481,648. The timing of sales data lags behind that of prices. That compares with 7.2% growth for England as a whole, which has an average house price of £234,278. The number of completed house sales in England fell by 22% to 64,311 in September, according to the Land Registry.
"Although house price growth remained strong in 2016, we expect demand for both residential and buy-to-let properties to dampen in 2017," said Andrew McPhillips, chief economist at mortgage lender Yorkshire Building Society.
"We are therefore likely to see little movement in house prices over the coming year. On the residential side, people are likely to have less spending power due to a combination of increasing inflation and stagnant wages which will make it even more difficult for people to save for a deposit.
"In terms of buy-to-let, tougher affordability requirements and a reduction in tax relief for mortgage interest payments could make letting properties less attractive to investors."
Price by country and government office region, November 2016
| England | £234,278 | 1.1% | 7.2% |
| Northern Ireland (Quarter 3 - 2016) | £124,093 | 0.8% | 5.4% |
| Scotland | £143,033 | 1.5% | 3.3% |
| Wales | £146,742 | -0.2% | 4.1% |
| East Midlands | £176,524 | 1.7% | 7.3% |
| East of England | £278,349 | 0.9% | 10.5% |
| London | £481,648 | 1.8% | 8.1% |
| North East | £126,989 | 1.3% | 3.2% |
| North West | £150,249 | 1.1% | 5.2% |
| South East | £313,334 | 0.3% | 8.6% |
| South West | £239,371 | 0.5% | 5.7% |
| West Midlands Region | £181,372 | 2.2% | 7.4% |
| Yorkshire and The Humber | £152,418 | 1.1% | 5.1% |
Number of sales by country, September 2016
| England | 64,311 | 82,452 | -22.0% |
| Northern Ireland (Quarter 3 - 2016) | 5,200 | 5,820 | -10.7% |
| Scotland | 9,352 | 8,618 | 8.5% |
| Wales | 3,492 | 3,896 | -10.4% |
© Copyright IBTimes 2025. All rights reserved.


