Technical analysis: How much can gold rise?

Gold has been showing some resilience since early last month off a 4-1/2-year low but it is still keeping the broad downtrend and is on track to hit the $1000-mark, as per trends.
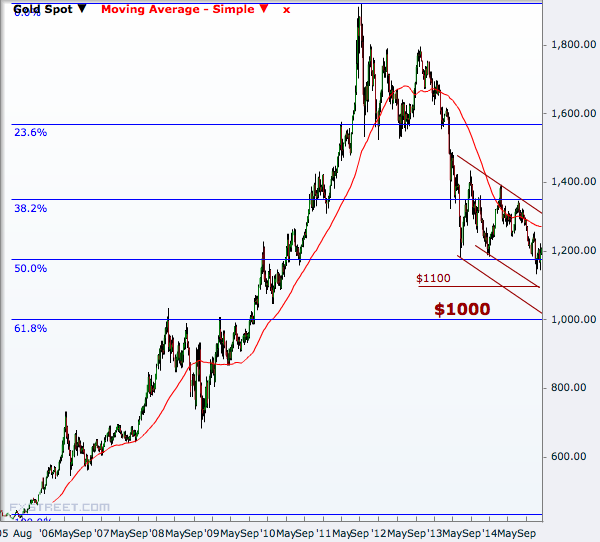
The big fall from the all-time high of $1920 hit three years ago has breached the 50% Fibonacci retracement of the 2005-2011 rally at $1180 last month and touched as low as $1131 before starting to edge higher.
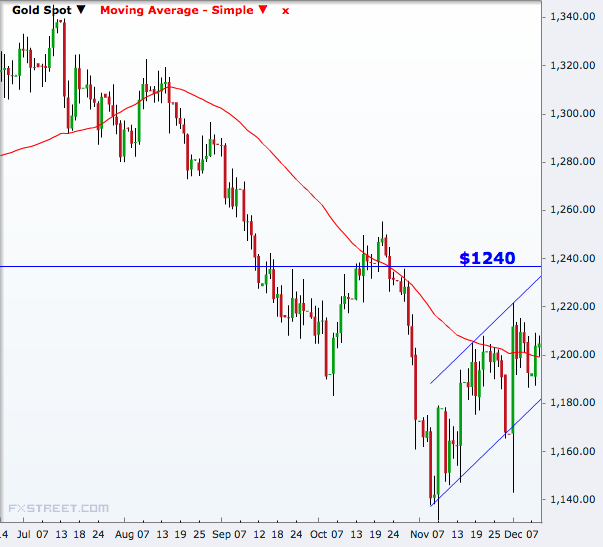
The yellow metal broke above the $1200-mark this week helped by safe haven flows routed from the greenback which has rallied sharply in the recent past.
This uptick could take it to $1240 at least where the metal is likely to face stiff resistance as that makes the upside barrier of the downward channel since May last year. (View the first graph below)
If that is broken successfully, then the $1300-1400 range will emerge as the next big resistance area. That area is crucial for the metal because a break of that will weaken the 18-month long downward channel and open doors to fresh highs near $1500.
However, that is far less likely than turning back south and aim the $1000 mark, which is the 61.8% retracement of the big six-year rally, as long as $1240 is not broken.
On the downside, the first level to watch beyond the recent lows will be $1100, which could be a channel support in case a narrow channel is considered.
With a broader channel, that support comes at $1000, matching the big Fibonacci level and psychological mark. [View the second graph below]
Gold has broken above the 50-period simple moving average (SMA) on the daily chart showing the near term bullishness but staying far below the same on the weekly chart shows the medium-to-long term bearishness.


© Copyright IBTimes 2025. All rights reserved.


