Yen Rallies to New High Amid Hong Kong Protests and US Dollar Decline

The Japanese yen has jumped to a near one-month high, further distancing from the six-year low touched earlier this month, as Asian stocks fell amid continuing protests in Hong Kong, and the US dollar decline.
On Monday, the USD/JPY fell to 107.05, its lowest since 16 September, and down 0.56% from Friday's close of 107.65.
Historically, risk aversion in the market is positive for the yen as Japanese investors rewind their "carry trade", the trade by which they sell the local currency in order to buy risk assets globally.
The MSCI Asia Apex 50 index was down 0.73%, mainly dragged by Taiwan's TSE which was down nearly 3% at some point in the day.
The drop in the dollar, however, was not equivalent to the rally in the Japanese currency, turning market players' attention to the USD/JPY technical analysis for more cues.
There was no change in the existing rate guidance in the Bank of Japan monetary policy statement published on 7 October.
Analysts are of the view that despite the major economies keeping ultra-loose monetary policies, cyclical upswings are bound to occur, as global economic recovery has not gathered sufficient steam.
So far in October, the yen has rallied 2.5% against the dollar while the dollar index, the gauge that measures the strength of the US unit against a trade-weighted basket of major currencies, has dropped just 0.5%.
USD/JPY Technical Analysis
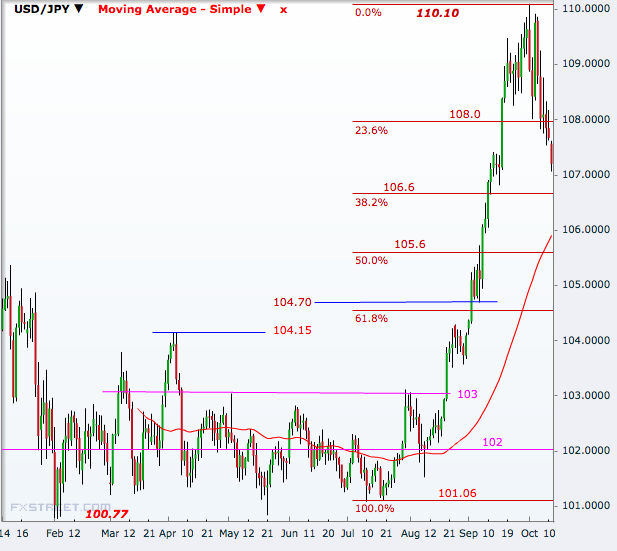
The pair had been on a steep upward trend in the three months through September and rallied about 8.3% during the period. But in the first half of October, it has retreated nearly 2.5%.
With the fall over the recent weeks, the pair has broken the 23.6% Fibonacci retracement of the July-September rally and is nearing the 38.2% level at 106.6, which is the nearest support line.
A break of that will take the pair 105.6, the 50% mark, which also falls below the fifty-day moving average. A break of that is likely to turn the SMA southward and significantly weaken the uptrend since July.
The next target on the downside will be the 104.70-104.15 area, a break of which will expose 103.0 immediately and then this year's lows just below 101.
On the higher side, the 23.6% line at 108.0 is the first resistance level, after which 109 should offer some lift resistance ahead of a retest of the 1 October peak multi-year high of 110.

© Copyright IBTimes 2025. All rights reserved.


