Gold: Recent Bullishness Weakens, Charts Still Suggest $1,000 Likely

With the US dollar index back to rising trend, gold has shown weakness over the past two sessions, in line with the broad technical picture that shows that the metal is poised for more downsides.
The yellow metal had been on a recovery mode over the past three weeks or so, but that has not aided a break of the downward channel being maintained since July, the daily chart shows.
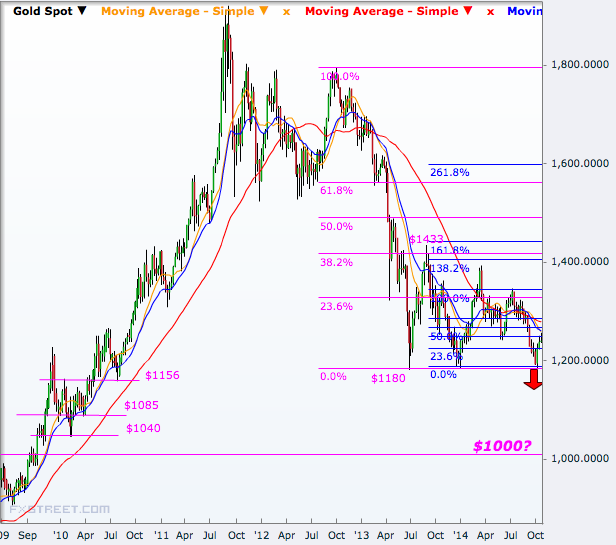
The weekly chart too highlights a bearish theme for gold. The metal has been on a lower highs-steady lows pattern since mid-2013 on the big picture analysis, suggesting a break lower, going forward.
In case the uptrend since 6 October resumes, the metal will aim the $1,257-1,271 region which covers the 50% Fibonacci retracement of the July-October selloff.
The next big level is $1,280 and then $1,320, before a retest of the July peak of $1,345. However, if the lower highs-steady lows pattern remains, then the metal will most likely break below $1,280 and retreat.
The Case for $1000
Technically, gold will not get out of the threat of $1,000 unless the $1,433 resistance barrier is broken. Momentum indicators do not show such a trend as of now and the case is for a downside break of the steady lows pattern since last year.
Three attempts to break below the $1,180 support have failed so far since June last year. With the current bullishness seeming weak, the next attempt is likely to open the doors to deeper lows.
The big level waiting down is $1,000 although $1,156 and $1,085 may offer some support on the way.

© Copyright IBTimes 2025. All rights reserved.


