Indian rupee slide: Strong bearish signals point to 68/$ levels in coming months

The Indian rupee reversed a portion of its big loss over the last week on Friday (8 May) helped by value buying of exporters and banks and gains in stocks but the currency remains vulnerable to retest 2013 record lows this year as per charts.
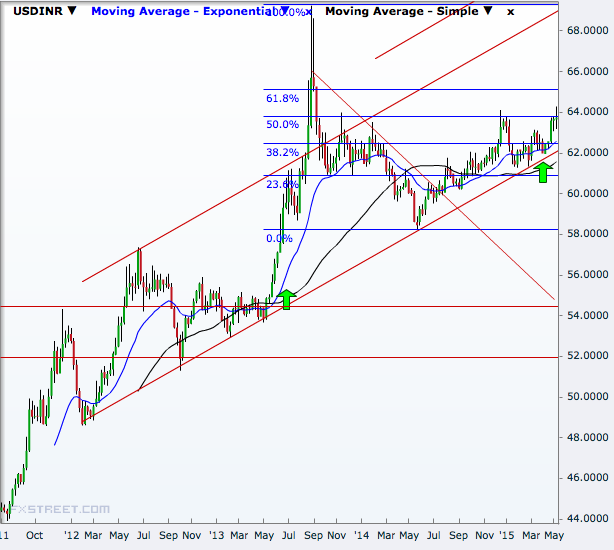
For the USD/INR pair, the upward tilt in the 50-period SMA on the weekly chart has gained momentum with the break of 64-mark last week, creating a very strong rupee-bearish signal similar to the July 2013 case.
The pair had soared to a record high of 69.23 before some strong fundamentals like reform optimism boosted the rupee ahead of the elections that elevated Narendra Modi to the post of prime minister.
Modi did several things but the rupee had to react to many factors including the dollar rally and global growth concerns. The Indian currency is now about 9% weaker than the 11-month high held almost a year ago.
Friday's break of 64.09, the 2014 high of the USD/INR, that took it to a 20-month high, has opened doors to 66.0 first and then levels above 68.0, as indicated by the upward trending channels dating back to early 2012.
The pair is now testing the 50% Fibonacci retracement of the September 2013-May 2014 selloff and therefore, the 61.8% level near 65.20 will be the next natural target on the higher side, ahead of the channel resistances mentioned above.
The channel support that came near 62.0 as of last week is now a very strong support for the pair in the near term. A break of that will expose 61.30-61.0 endorsed by the 50-week SMA and 23.6% Fibonacci line.
A break of that will weaken the uptrend and open doors to 60 and then 58.23. Such a move will reopen the downside trend since September 2013, exposing a much deeper support zone of 54-52.
© Copyright IBTimes 2025. All rights reserved.


