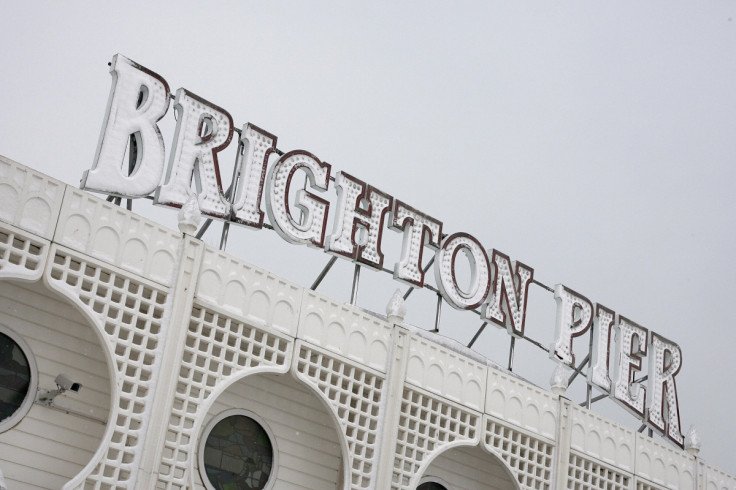
UK housing: Rents rising faster in Brighton and Bristol than anywhere else

Rents are rising faster in Bristol and Brighton than anywhere else in the UK, according to new figures. In both cities, the average rent is rising at a rate of 18%. In London, where rents are highest, growth is 11%.
A rising population and shortage of housing supply has driven up private rents in recent years, particularly in London and the south east of England. The homeownership rate has also fallen to 63% in the UK, its lowest for nearly three decades, putting extra strain on the private rented sector. Housebuilding is running at around half the level needed to meet demand.
In 2014, the average rent was £913 in Brighton and £767 in Bristol. By 2015, these had jumped to £1,078 and £904 respectively. London's average rent hit £1,596. The average rent outside of the capital is £739 after rising 4.9% over the year. The data is from a rental index compiled by HomeLet, a property services firm, and based on the rents agreed in new tenancies in 2015.
"2015 was a year in which rents on new tenancies were up on 2014 in almost every area of the country," said Martin Totty, chief executive of Barbon Insurance Group, which owns HomeLet. "While we saw a moderation in the rate at which rents increased during the final months of the year, and even some falls in a number of regions, the sector overall has continued to see strong demand."
Rents are rising at a much faster pace than the cost of living and wages
Inflation: 0%
Wage growth: 2%
Rental growth outside of London: 4.9%
Rental growth in London: 11%
Sources: ONS, HomeLet Rental Index
Top 15 UK towns and cities with highest rental market growth in 2015*
| Top 15 UK towns and cities with highest rental market growth in 2015* | |||
| City/Town | Average rents in 2015 and 2014 on new tenancies | ||
| 2015 | 2014 | % rise | |
| Brighton | £1,078 | £913 | 18% |
| Bristol | £904 | £767 | 18% |
| Edinburgh | £819 | £707 | 16% |
| Newcastle | £588 | £506 | 16% |
| Greater London | £1,596 | £1,435 | 11% |
| Liverpool | £673 | £607 | 11% |
| Glasgow | £636 | £586 | £9% |
| Coventry | £754 | £699 | 8% |
| Leeds | £691 | £648 | 7% |
| Manchester | £727 | £691 | 5% |
| Nottingham | £586 | £556 | 5% |
| Belfast | £606 | £579 | 5% |
| Sheffield | £604 | £581 | 4% |
| Birmingham | £675 | £647 | 4% |
| Leicester | £638 | £611 | 4% |
*Based on new tenancies signed in 2015 compared to new tenancies signed in 2014. Analysis completed on the UK's most populated towns and cities.
Rental figures from the December 2015 HomeLet Rental Index
| Region | Average rent 3 months to December 2015 | Average rent 3 months to November 2015 | MonthlyVariation | Average rent 3 months to December 2014 | Annual variation |
| Scotland | £630 | £648 | -2.8% | £611 | 3.2% |
| North East | £531 | £530 | 0.1% | £521 | 1.9% |
| Yorks & Humbs | £623 | £626 | -0.5% | £604 | 3.1% |
| East Midlands | £638 | £635 | 0.4% | £600 | 6.4% |
| East Anglia | £799 | £805 | -0.7% | £756 | 5.7% |
| Greater London* | £1,523 | £1,544 | -1.4% | £1,410 | 8.0% |
| South East | £936 | £943 | -0.8% | £875 | 7.0% |
| South West | £840 | £849 | -1.1% | £796 | 5.5% |
| Wales | £599 | £595 | 0.8% | £586 | 2.3% |
| West Midlands | £666 | £659 | 1.0% | £654 | 1.7% |
| North West | £622 | £631 | -1.5% | £655 | -5.1% |
| Northern Ireland | £570 | £580 | -1.8% | £574 | -0.6% |
| UK ex Greater London | £739 | £743 | -0.6% | £704 | 4.9% |
| Notes:source HomeLet | Based on new tenancies in October, November and December 2015 | Based on new tenancies in September, October and November 2015 | Comparison of average rent in 3 months to end December 2015 and 3 months to end November 2015 | Based on new tenancies in October, November and December 2014 | Comparison of average rent in 3 months to end December 2015 & 3 months to end December 2014 |
© Copyright IBTimes 2025. All rights reserved.


