Here are the trade routes that cause the most devastation to wildlife
Consuming goods in one country can lead to a dramatic wildlife decline in another.
A new map showing hotspots of threats to wildlife will help improve conservation strategies, scientists have said. For the first time, they have identified which threat hotspots are driven by which consumers around the world, and identified the trade routes that most contribute to species' decline.
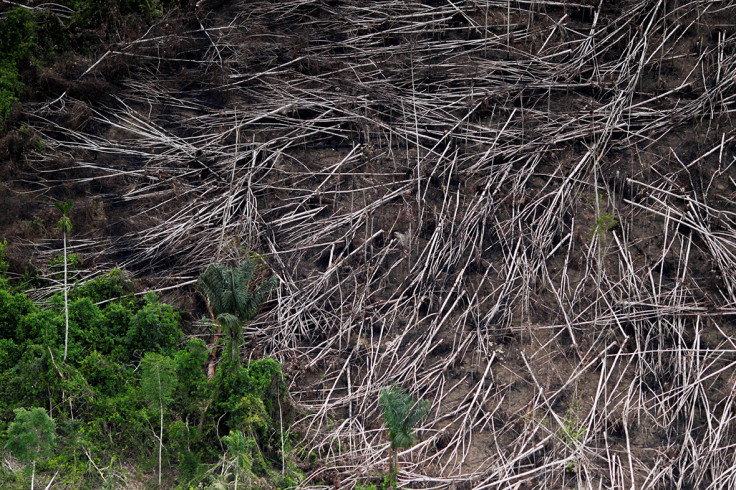
Humans are responsible for a number of threats to wildlife, from deforestation, intensive agriculture and pollution to over-fishing and hunting. This impact on their environment is usually the result of having to find food and other natural resources to live.
Previous studies have shown that at least one-third of biodiversity threats globally are linked to production for international trade but they have not precisely considered the role of supply chains in connecting demand for natural resources with final consumption of goods.
Understanding market forces and global demand for wildlife products may thus help improve current protection strategies. The study, published in the journal Nature Ecology and Evolution, attempts to locate hotspots of threats to wildlife and to describe how they relate to consumers' demand in other parts of the world.

The idea is that companies participating in international trend may change their behaviours using on a map summing up all the findings. "Our map can help companies make a careful choice of how their inputs are sourced and reduce the impact on biodiversity. We hope that the companies compare our maps and their procurement places and then reconsider their supply chains", lead author Keiichiro Kanemoto, from Shinshu University, Japan, told IBTimes UK.
Threatened species vs trade
To come up with their map, the scientists have combined other, existing maps to pinpoint where a 6,803 threatened species could be found in the world. They then linked the threats that these species faced to one or more human industries, and then traced the commodities produced by these industries to the final consumers worldwide.
This allowed them to find out which countries where driving species decline in others, and to calculate the percentage of threat to a species due to the consumption of goods in another region of the world.

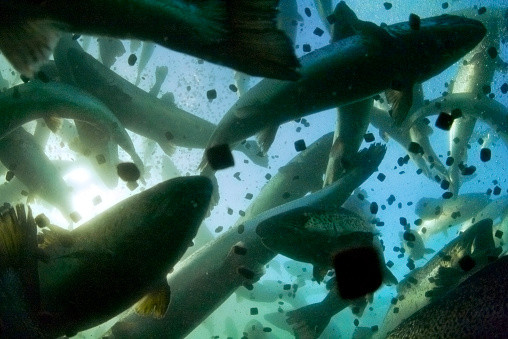
Some of the most important findings include that south-east Asia is the dominant threat hotspot in the world, with the United States and European Union both driving the threats there, due to fishing, pollution and intensive aquaculture. Another example is Brazil, where the authors find that 2% of the 'vulnerable' stub-footed toad's threat score is estimated to be directly due to logging from forestry industries linked to the consumption of goods in the United States.
The scientists say that their map can be useful resources for all actors from producers and conservationists to final consumers – who could make more informed choices about what products they buy and how likely this is to affect wildlife.
"Companies can start better prevention strategy from now on, without having to conduct additional assessment. If companies then provide the origin of their products, consumers may use the map to realise the connection between their consumption and real wildlife threats", Kanemoto concluded.
© Copyright IBTimes 2025. All rights reserved.


